The YAML header is located at the beginning of the RMD file and contains metadata about the document, such as the title, author, date, and output format. Here is an example of a YAML header:
markdown Text
Markdown is a lightweight markup language with plain text formatting syntax. In an RMD file, you use Markdown to format the text, create lists, headers, links, and more. For example:
Styles Example
Code Chunks
Code chunks allow you to embed R (or other languages) code within the document. These chunks are executed when the document is rendered, and their output is included in the final document. Code chunks are defined with triple backticks and the language, like this:
Code Chunk Example
Chunk output can be customized with knitr options, arguments set in the {} of a chunk header.
include = FALSE prevents code and results from appearing in the finished file. R Markdown still runs the code in the chunk, and the results can be used by other chunks.
echo = FALSE prevents code, but not the results from appearing in the finished file. This is a useful way to embed figures.
message = FALSE prevents messages that are generated by code from appearing in the finished file.
warning = FALSE prevents warnings that are generated by code from appearing in the finished.
fig.cap = “…” adds a caption to graphical results.
Arguments of Chunk
Output Formats
RMD files can be rendered into various output formats including HTML, PDF, and Word documents. The output format is specified in the YAML header. To generate the final document, you use the knit function in RStudio or call rmarkdown::render() in your R script.
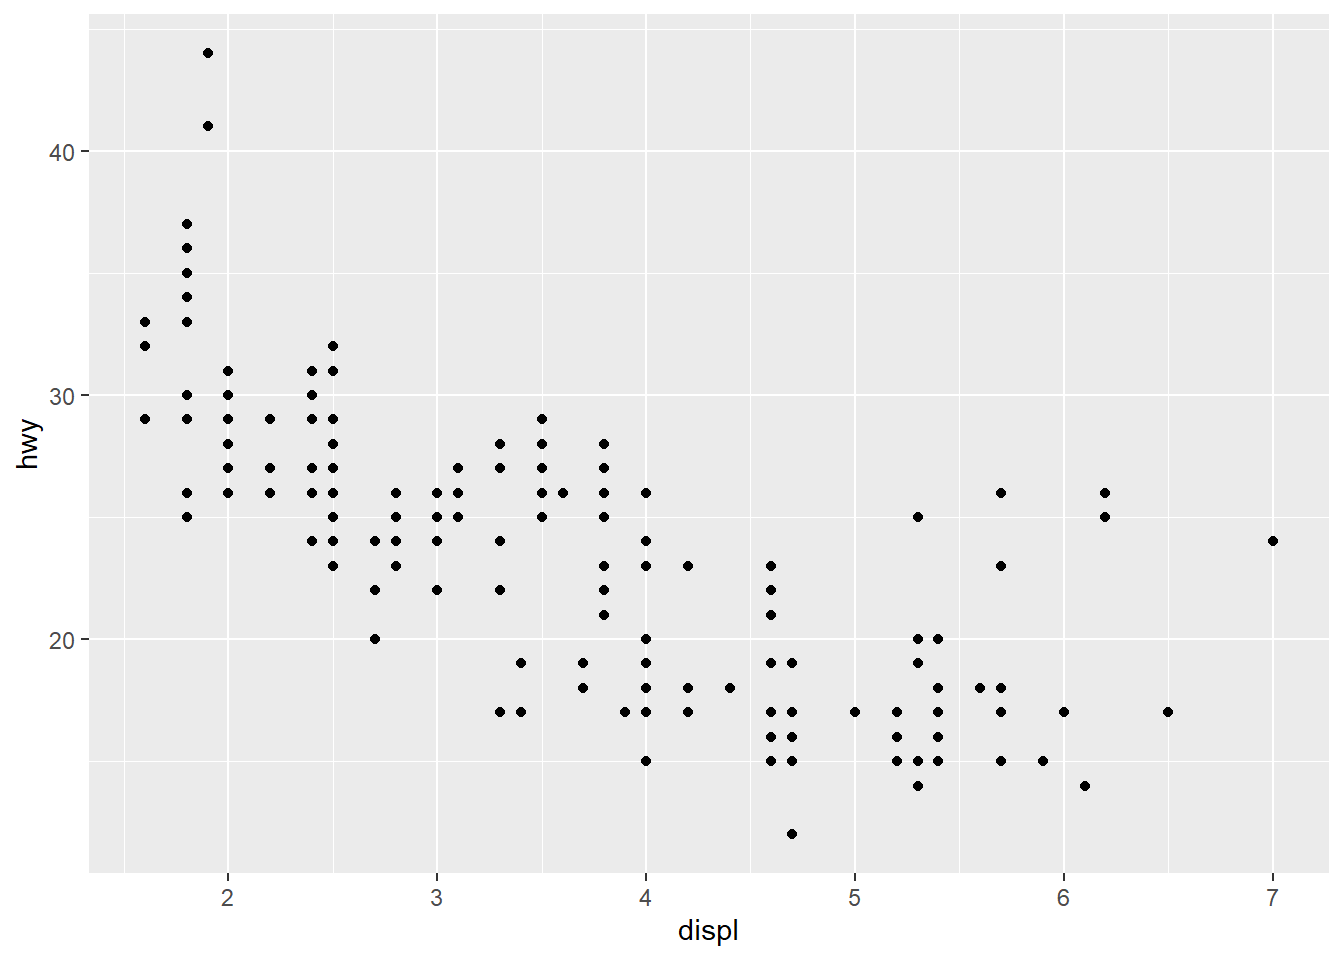
Visualization and Plots
RMD files can include visualizations and plots. For example, you can create and embed a plot using the ggplot2 package.